Big in Purchasing Power, Small in Dollars: Russia's Economy in a Comparison of Countries and Citizens

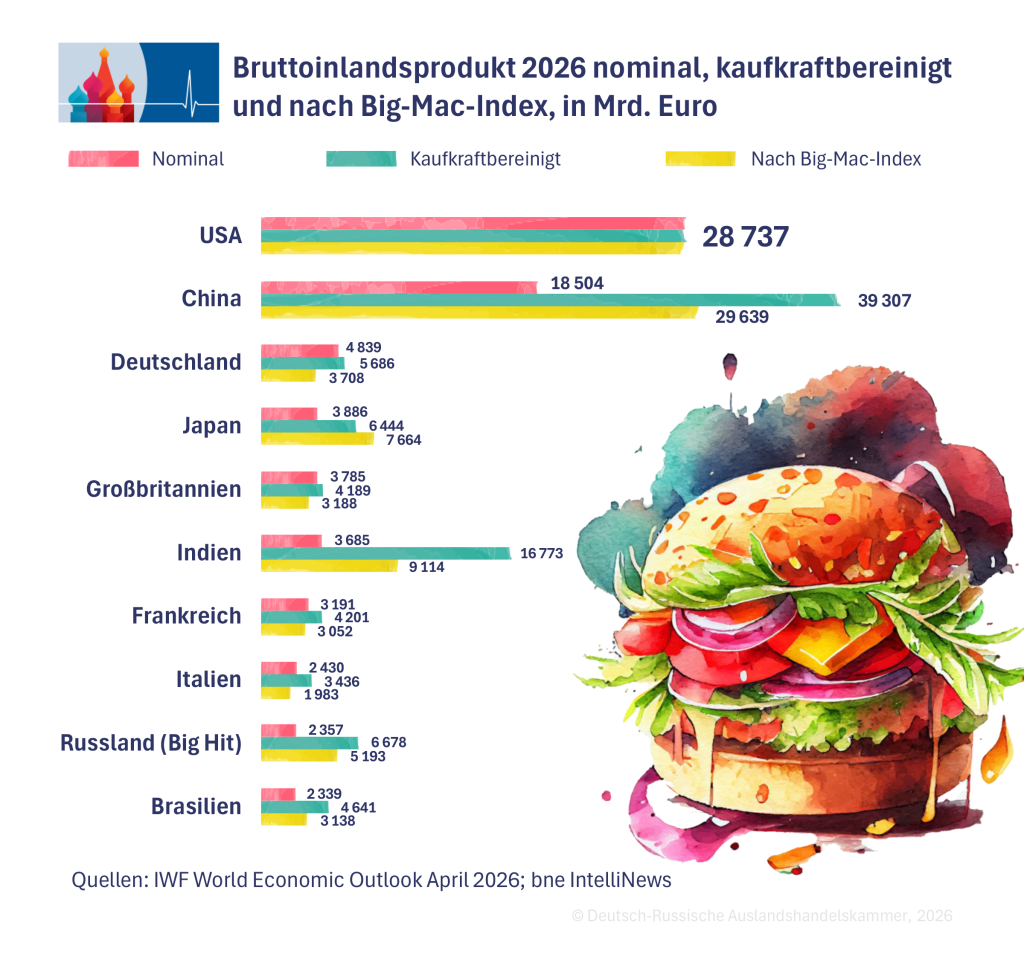
Russia is the world's fourth-largest economy—or the eleventh-largest, depending on how you measure it. At market exchange rates, the International Monetary Fund (IMF) estimates Russia’s GDP for 2026 at 2.66 trillion U.S. dollars. That puts it in ninth place. Adjusted for purchasing power, the figure is 7.5 trillion U.S. dollars, placing it fourth, ahead of Japan and Germany. If economic output is converted into Big Macs, Russia ranks fifth and Germany sixth. These are the findings of calculations by the Berlin-based economic news agency bne IntelliNews to mark the 40th anniversary of the Big Mac Index.
Three Measures of an Economy’s Size
The most common measure is nominal GDP. To calculate this, economic output in the local currency is converted into U.S. dollars at the market exchange rate. If the ruble depreciates by 20% against the U.S. dollar, Russia’s GDP in dollars shrinks by the same proportion, even though factories aren’t producing any less.
The second measure is purchasing power parity (PPP)-adjusted GDP. It is based on the theory of purchasing power parity: in the long run, exchange rates should be such that an identical product costs the same everywhere. To determine this, statisticians track the prices of hundreds of goods and services in nearly every country in the world. From this data, they calculate conversion rates that account for price differences. In countries with a low price level, purchasing power-adjusted GDP is therefore significantly higher than nominal GDP.
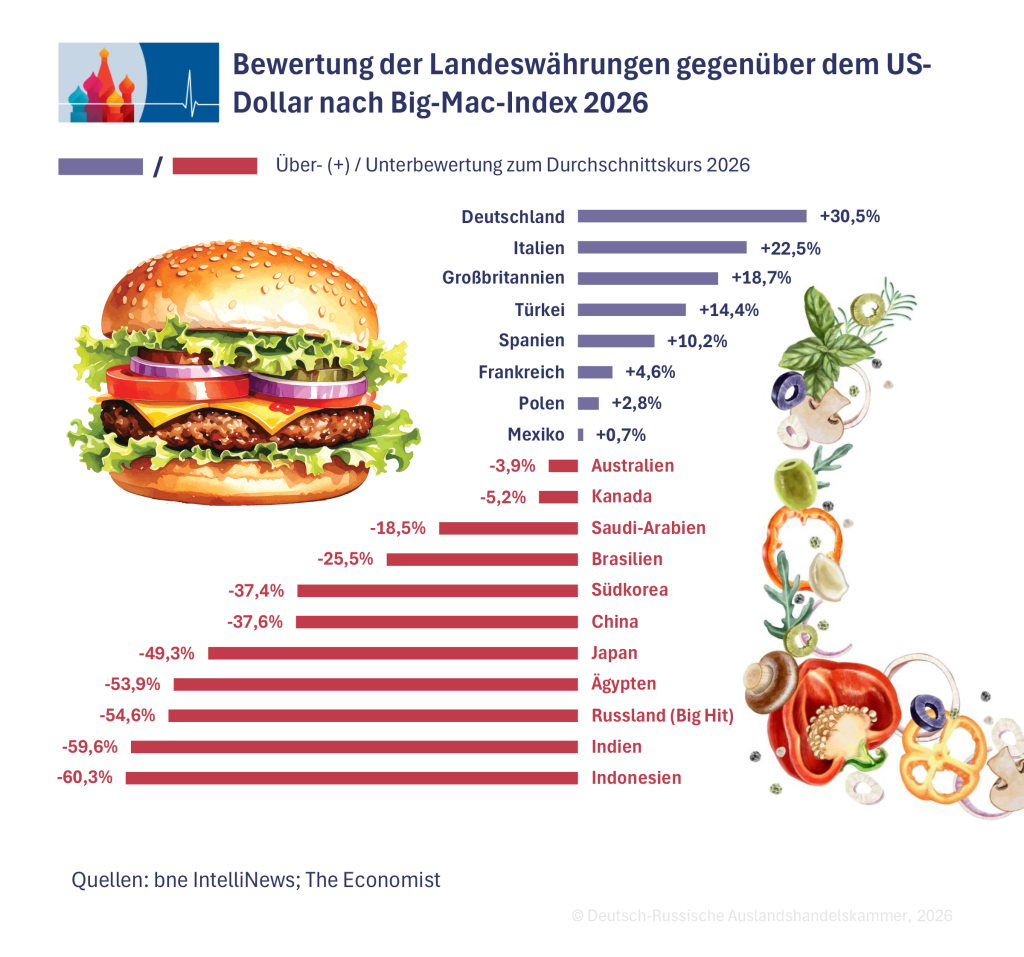
A third measure is the Big Mac Index. Business journalist Pam Woodall developed it in September 1986 for the British business magazine *The Economist*. Instead of a basket of goods, it uses a single product that is made according to the same recipe almost everywhere in the world. The calculation involves two steps. First, the local price of the burger is divided by the U.S. price to obtain a “burger exchange rate.” This is then compared to the market exchange rate. In Russia, the Big Hit—the equivalent of the Big Mac at the successor chain “Vkusno i Tochka” (English: “Simply Delicious”)—costs 221 rubles (2.29 euros). In the U.S., a Big Mac costs $6.22. This results in a “burger exchange rate” of 35.53 rubles per U.S. dollar. On the foreign exchange market, one U.S. dollar cost an average of 78.27 rubles this year. Measured by the burger, the ruble is thus actually undervalued by about 57% compared to the Russian Central Bank’s current exchange rate of 82.55 rubles (as of November 11, 2026).
Graphic: German-Russian Chamber of Foreign Trade
To calculate GDP in “burger currency,” divide the economic output in the local currency by the local price of a burger and multiply the result by the U.S. price. This creates a fictional currency: the “burger dollar.” It does not require an exchange rate. Russia has been absent from The Economist’s index since McDonald’s withdrew in 2022; the last Russian Big Mac cost 135 rubles in January 2022. The Big Hit at “Vkusno I Tochka” is now 64% more expensive.
Nominal GDP: Russia ranks between eighth and eleventh
In rubles, Russia’s GDP reached 214.3 trillion last year—a real increase of 1% over the previous year, according to the statistics agency Rosstat. At the Russian Central Bank’s average annual exchange rate, this amounts to 2.3 trillion euros. In the first half of 2026, Russia generated 106 billion rubles (1.1 billion euros), a real increase of 0.6% compared to the same period the previous year.
For 2026, the International Monetary Fund (IMF) estimates Russia’s GDP at 2.66 trillion U.S. dollars. This places Russia behind the U.S. (32.4 trillion), China (20.9 trillion), Germany (5.5 trillion), Japan, the United Kingdom, India, France, and Italy. The figure depends on the ruble exchange rate, which has fluctuated more sharply this year than any other currency among the countries surveyed. According to the Russian Central Bank, the ruble rose to 70.79 rubles per U.S. dollar by May 22. By September 3, it had fallen to 87.00 rubles—a 23% range in just over three months.
In terms of GDP in U.S. dollars, this results in a range of 2.38 to 2.94 trillion U.S. dollars, equivalent to 2.1 to 2.6 trillion euros. When the ruble peaked in May, Russia was the eighth-largest economy in the world, ahead of Italy. At its low in September, it ranked eleventh, behind Canada. At the current exchange rate, Russia ranks tenth, behind Brazil, whose real has gained 4.7% since January. Depending on the week, the value of that same economy fluctuated by as much as $550 billion (€488 billion).
Other countries experienced similar fluctuations. India ranked fifth at the beginning of the year but dropped to sixth place in September, behind the United Kingdom. Turkey lost $210 billion (€186 billion) on paper because the lira has depreciated by 12.1% since January. This had no effect on actual production.
Graphic: German-Russian Chamber of Foreign Trade
Adjusted for purchasing power: Russia ranks fourth, ahead of Japan and Germany
According to the IMF, Russia’s purchasing power-adjusted GDP this year stands at 7.5 trillion U.S. dollars. That represents about 3.4% of the global economy. Ahead of Russia are only China with 44.3 trillion, the U.S. with 32.4 trillion, and India with 18.9 trillion U.S. dollars. Japan follows with 7.3 trillion, and Germany with 6.4 trillion U.S. dollars. The ratio of purchasing power-adjusted GDP to nominal GDP for Russia is 2.83. This means that a U.S. dollar exchanged for rubles buys nearly three times as much in Russia as it does in the U.S.
In Germany, the factor is 1.18; in India, 4.55; and in Egypt, 5.97. The World Bank reached the same conclusion in its International Comparison Program for 2021. In that report, Russia ranked just ahead of Japan and Germany, with a GDP of 5.7 trillion U.S. dollars and a 3.8% share of the global economy, compared to Japan’s 3.7% and Germany’s 3.4%. The Moscow government regularly cites this ranking. “Russia continues to hold fourth place in the world in terms of purchasing power parity,” said President Vladimir Putin in late May during a state visit to Astana, the capital of Kazakhstan.
The purchasing power parity measure changes the rankings more than any other. India jumps from sixth to third place, Indonesia from seventeenth to seventh, and Turkey from sixteenth to eleventh. The United Kingdom falls from fifth to tenth place. In terms of purchasing power parity, China is already the world’s largest economy, with a lead of nearly 12 trillion U.S. dollars over the United States.
In Burger currency: Russia ranks fifth
The “burger” figure falls between the two measures. Russia’s GDP reaches 5.85 trillion “burger” dollars. That is more than twice the nominal value, but less than the purchasing power-adjusted figure. Russia thus rises from ninth to fifth place. At the top, China, with 33.4 trillion burger dollars, narrowly overtakes the U.S., which stands at 32.4 trillion. India follows in third place with 10.3 trillion. Japan comes in at 8.6 billion, even surpassing its purchasing power-adjusted value. The Japanese Big Mac costs 500 yen, making it the cheapest in an industrialized country.
Germany is losing ground in “burger currency.” Its nominal value of 5.45 trillion U.S. dollars (4.8 trillion euros) translates to 4.18 trillion “burger dollars,” dropping it from third to sixth place. According to *The Economist* data, the German Big Mac costs 6.99 euros, 27% more than in January 2024. Based on this calculation, the euro is overvalued by 30.5%.
The United Kingdom, France, and Italy are also falling behind. Turkey receives no premium at all because its Big Mac, at 325 lira, costs more than the American one. Yet, according to the IMF, one U.S. dollar goes 2.5 times as far there.
For wealthy countries, the burger calculation largely aligns with the IMF’s purchasing power data. For poorer countries, it captures only part of the gap. In Egypt, according to the IMF, one U.S. dollar buys six times as much as in the U.S., but in terms of burgers, it buys barely twice as much. The reason lies in the price of the burger: it consists primarily of rent, wages, and local taxes, which are low in poorer countries.
Graphic: German-Russian Chamber of Foreign Trade
Per Capita: Three Measures, Three Results
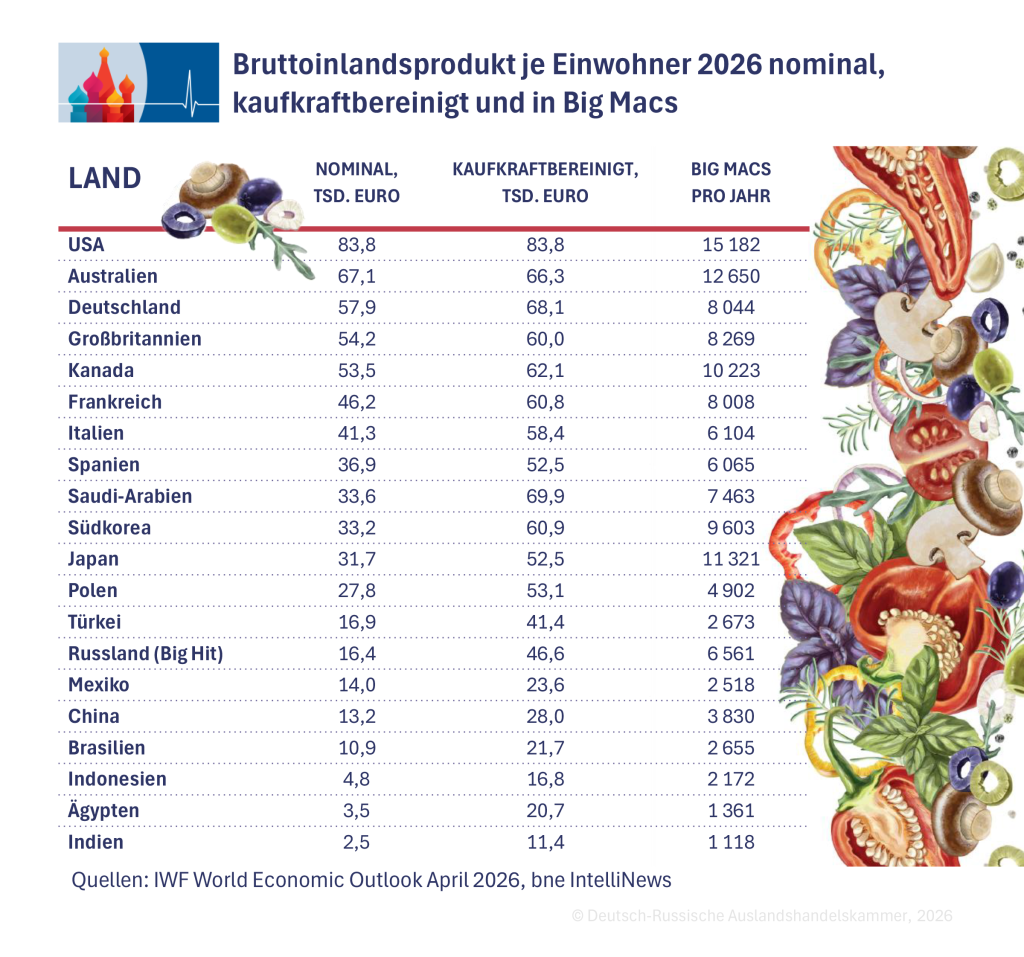
Russia’s ranking per capita varies greatly depending on the metric used. In nominal terms, according to the IMF, every Russian earns $18,525 per year. This places Russia alongside Turkey, Mexico, and China. Adjusted for purchasing power, the figure is $52,479—more than in Turkey and less than in Spain and Poland. In “burger currency,” a Russian consumes 6,561 Big Macs per year, putting them on par with Italy and Spain. A German earns 8,044 Big Macs, while an American earns 15,182.
When it comes to income, the “burger calculation” also paints a different picture than the exchange rate. According to Rosstat, the average gross wage in Russia in July was 109,524 rubles (1,137 euros), 9.5% more than in the same month last year, reports the RIA Novosti news agency. That equates to 496 Big Hits per month. Based on net wages from the Numbeo price database, a Russian works 26 minutes for one Big Hit, a German 22 minutes for one Big Mac, and an American 13 minutes. An Egyptian needs just under three hours.
Physical Measures: Electricity and Borscht
In addition to monetary measures, economists also assess economies using physical data that is not distorted by exchange rates or price levels. A common metric is electricity consumption. According to the London-based energy think tank Ember, among individual countries, only China, the U.S., and India consume more electricity than Russia. Japan and Brazil follow behind. The top five spots thus correspond to the purchasing power-adjusted GDP ranking. Last year, however, Russian electricity demand fell by 1.4%.
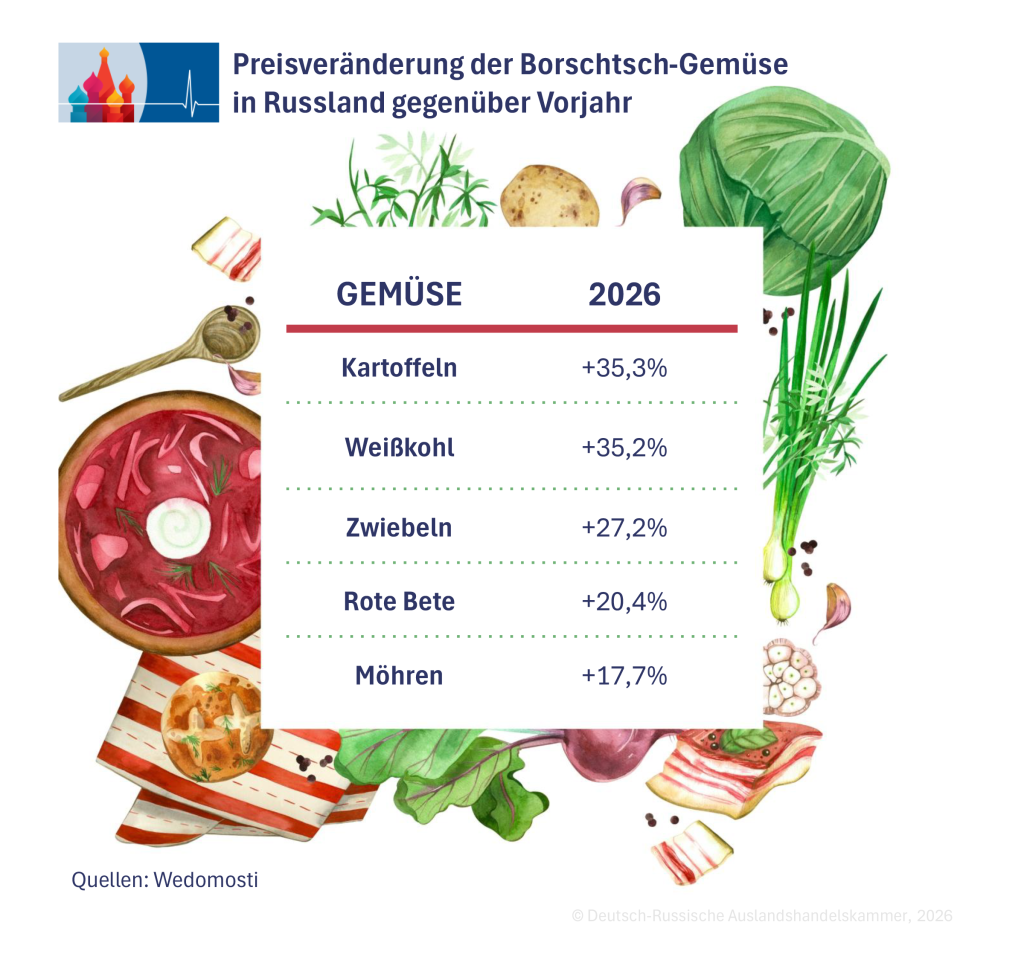
Russia has its own measure of the cost of living: the borscht index. It tracks the prices of beets, cabbage, potatoes, carrots, and onions and consists solely of domestically produced goods. According to Rosstat, the price of the borscht basket rose from 205 to 320 rubles (3.32 euros) between December 2025 and June 2026, an increase of 56%.
At the end of August, according to Rosstat, potatoes were 35.3% higher than the previous year’s price, and cabbage was 35.2% higher, reports the Moscow business newspaper Kommersant. “This year, prices are rebounding after last year’s sharp decline,” says Tatiana Gubina, chief of staff at the Association of Potato and Vegetable Producers.
Graphic: German-Russian Chamber of Foreign Trade
Outlook: Weak Growth, Rising Prices
Russia’s real economic growth has slowed significantly. According to Rosstat, GDP contracted by 0.2% in the first quarter and grew by 1.3% in the second, reports the Interfax news agency. The Russian Central Bank expects growth of 0% to 1% for the full year, while Economy Minister Maxim Reshetnikov cited 0.6% in early September. Growth in the second quarter was “exclusively linked to sectors of the military-industrial complex,” according to experts at the Institute for Economic Forecasting of the Russian Academy of Sciences.
Inflation, on the other hand, is picking up again. According to Rosstat, the annual rate stood at 6.25% at the end of September. “We estimate inflation at the end of 2026 to be 6.8%. By the end of 2027, we expect inflation to return to 4%,” says Reshetnikov. In May, his ministry had still projected a rate of 5.2%. Rising prices increase nominal ruble GDP, but not real economic output. The ruble exchange rate continues to be the primary determinant of GDP in dollar terms.
Source: German-Russian Chamber of Foreign Trade, “Big in Purchasing Power, Small in Dollars: Russia’s Economy in a Country-by-Country and Per-Capita Comparison,” November 12, 2026.
This article was prepared for the German-Russian Chamber of Foreign Trade.
Earlier coverage: Russia
- Russia: industrial output rises 1.8% in September · November 9, 2026
- Russia's Auto Market: Recovery from a Low Base · November 9, 2026
- Russia: GDP grows just 0.5% in September · November 2, 2026
- Cabinet reshuffle: four new appointments, one "superminister" · October 30, 2026
The day's most important Russian economic stories. Free, in your inbox three times a week.
Mon, Wed, Fri. Double opt-in, unsubscribe anytime. By subscribing you consent to the processing of your email address as described in our Privacy Policy.